
Industrial fires rarely damage only buildings. What’s often far more costly are the operational consequences. Two cases in Indonesia illustrate this with striking clarity.
On January 27, 2026, a massive fire destroyed the Swallow sandal factory owned by PT Garuda Mas Perkasa in Medan, North Sumatra.
The fire took more than 15 hours to control, with 90 percent of the entire production facility damaged. Employees were temporarily laid off as operations came to a complete halt.
Investigators traced the cause to an electrical short circuit in the chemical warehouse area, which spread rapidly due to the presence of rubber materials and other flammables, resulting in loud explosions.
A similar case occurred in the Jababeka industrial area in Cikarang in September 2022. The fire gutted two factories simultaneously, PT Eon Chemical and PT Tunas Mitra Sukses, with total losses estimated at Rp 20 billion.
The fire originated in the chemical warehouse of PT Eon Chemical, which produces specialty chemicals, before quickly spreading to the adjacent adhesive tape and plastic manufacturing plant.
Containment took more than 12 hours due to the abundance of flammable chemicals. One chemical warehouse with improperly identified risk, and the fire did not stop at a single point. Losses reached Rp 20 billion.
Looking at both cases, the common thread is clear. The fire did not stay contained because no one had ever mapped how materials, layout, and production processes interact as a unified risk system.
What should have been a localized incident escalated into an operational disaster with losses far exceeding the physical damage.
Why Fire Risk Must Be Analyzed Based on Production Processes
Not all areas in an industrial facility carry the same level of risk. A generic approach that treats all industrial zones equally will produce a misdirected protection system, excessive in some areas and dangerously insufficient in the most hazardous ones.
Production processes determine where ignition sources can emerge, how much fuel is available, and how quickly a fire can develop.
Welding in a fabrication line, drying in a textile facility, or solvent mixing in a chemical plant each generates a unique risk profile that cannot be managed with the same template.
International standards, such as NFPA 551, FM Global, and ISO 31000, all emphasize process-based and operational context risk analysis. Compliance with these standards has direct implications for:
- Insurers’ risk grading determines industrial property insurance premiums.
- Regulatory audit outcomes from the Ministry of Manpower, the Fire Department, and BPBD.
- Coverage requirements for property insurance and business interruption insurance.
- Due diligence assessments from investors, business partners, and corporate clients.
Who Needs to Conduct a Process-Based Fire Risk Assessment?
Process-based fire risk assessment is relevant for decision-makers responsible for operational safety, regulatory compliance, and asset protection at industrial facilities:
1. Plant Managers & Operations Directors
Bear direct responsibility for production continuity and operational safety. A process-based fire risk assessment provides an accurate risk map for every production line, enabling data-driven decisions on layout, SOPs, and protection system placement.
2. HSE Managers & Safety Officers
Need structured risk assessment documentation to comply with NFPA, Permenaker No. 2/1983, and FM Global standards. Assessment results also form the foundation for fire drills, emergency response planning, and HSE training that reflects the facility’s actual risk profile.
3. Risk & Compliance Officers
Face increasingly stringent regulatory audits and insurance requirements. Global insurers such as FM Global, Zurich Insurance Group, and AXA XL frequently request process-based risk assessments before setting premiums for large industrial facilities.
4. CFOs & Finance Directors
Must recognize that fire can severely impact the company’s cash flow. An investment in fire risk assessment, ranging from Rp 80–300 million, can help reduce insurance premiums, prevent costly downtime, and preserve asset value.
5. Project Managers of New Facilities
They should know that for new facilities or expansion projects, conducting a fire risk assessment during the design phase is far more cost-effective than retrofitting protection systems after construction.
Key Parameters in Calculating Process-Based Fire Risk
1. Material Characteristics in the Production Process
Every material involved in the production process must be identified based on its chemical properties, whether it is flammable, reactive to heat, or produces hazardous gases when burned.
Plastics, organic solvents, and synthetic foam have calorific values far exceeding those of wood or paper, meaning fires involving these materials burn hotter and spread faster.
2. Energy Sources and Ignition Potential
Ignition sources in production environments are highly varied, such as heat from continuously operating machinery, sparks from welding processes, static electricity from certain materials, and friction between components.
Every process stage must be examined to identify which energy sources could serve as a fire’s starting point.
3. Layout Configuration and Fire Load Density
Fire load density is the total heat energy that can be released by all combustible materials in an area, divided by the floor area. Measured in MJ/m², it determines how intense and prolonged a fire can be.
| Fire Load Density | Classification | Protection System Implications |
| < 400 MJ/m² | Low Hazard | Office areas, standard detection system |
| 400–800 MJ/m² | Moderate Hazard | General manufacturing, conventional sprinklers |
| 800–1.500 MJ/m² | High Hazard | Chemical/paint areas, automatic suppression required |
| > 1.500 MJ/m² | Very High Hazard | Custom design, insurer coordination required |
An office with furniture, paper, and carpet typically falls in the 400–800 MJ/m² range and can generally be managed with sprinklers and a standard fire detection system.
In contrast, production areas or warehouses storing plastics and rubber pose a significantly higher risk; plastics have a calorific value of approximately 35 MJ/kg, nearly twice that of wood or paper.
A packaging storage area with cardboard and plastic wrap can easily exceed 1,000 MJ/m², requiring higher-capacity suppression systems, strict fire compartmentation, and detectors responsive to rapid temperature rises.
4. Asset Value and Operational Impact
Beyond the physical fire potential, risk assessment must account for the business consequences at every affected point. Areas with high asset values or that serve as production bottlenecks must be prioritized, because a fire there can halt all operations even if the physical scale is relatively small.
What is frequently underestimated is that the greatest losses are not always from physical damage but from operational shutdowns, such as lost revenue, contract penalties, overtime costs to recover from delays, and the potential long-term loss of clients.
According to NFPA data, fires at manufacturing and industrial facilities cause an average of USD 1 billion in direct property losses per year in the United States alone, and this figure does not include business interruption losses.
Methodology for Calculating Process-Based Fire Risk
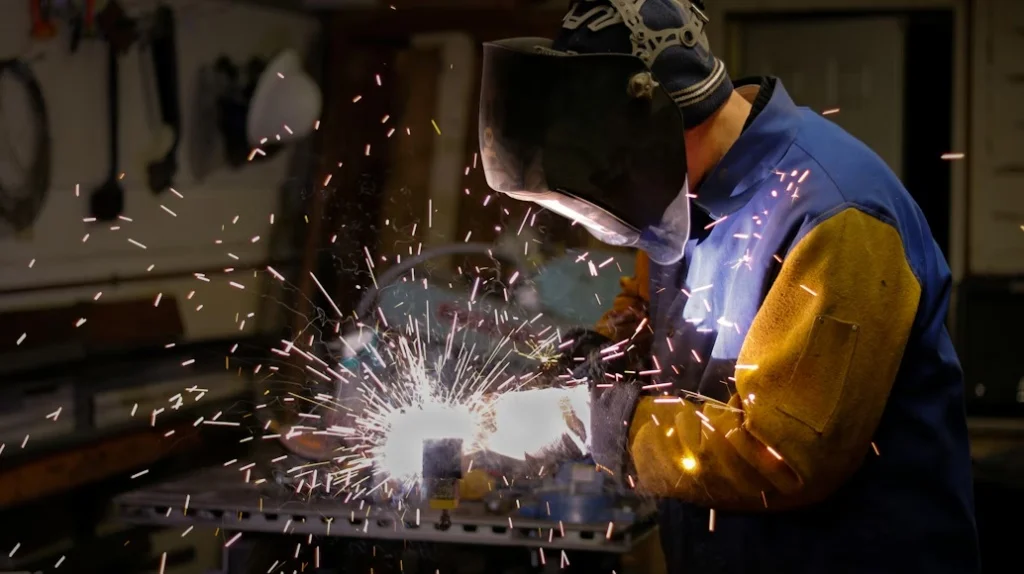
This methodology is illustrated using a metal component manufacturing plant with production processes spanning fabrication, welding, painting, and finished goods storage.
Step 1: Identify Production Process Stages
Map the entire production flow from start to finish, including raw material storage areas, core processes, and packaging areas. Each stage is treated as a separate unit of analysis, as each can have a distinct risk profile.
In this example, four stages are identified: the metal fabrication area, welding stations, the paint room, and the finished goods warehouse. The location, floor area, and activities at each are documented.
Step 2: Hazard Identification per Process Stage
For each stage, identify the three elements of the fire triangle, such as ignition source, fuel, and oxygen, and document the types of materials used, operating temperatures, and activities taking place.
At the welding station, ignition sources include sparks and heat from the welding process, while fuel sources include metal shavings, oily rags, and nearby insulation materials.
In the paint room, solvent-based paint vapors can accumulate past their flammable concentration threshold, making this one of the most critical areas from a fire risk standpoint.
Step 3: Analyze the Probability of Fire Occurrence
Probability is calculated based on the frequency of exposure to ignition sources, the reliability of existing control systems, and the incident history of similar areas or processes. Historical fire data from the same industry sector serves as an important reference.
At the welding station, which operates 8 hours a day, ignition frequency is very high, and controls are limited to a hot-work permit procedure that is not consistently followed.
Based on data from similar industries, the incident probability in this area falls in the moderate-to-high category. The paint room carries a lower probability due to an installed mechanical ventilation system, but remains at risk given the absence of gas detectors.
Step 4: Analyze Fire Consequences
Consequences must be measured across two separate dimensions:
- Physical impact, covering asset damage, potential casualties, and fire spread;
- Operational-financial impact, covering daily downtime cost, client contract disruptions, SLA penalties, cash flow effects, and potential premium increases.
In this example, the welding station sits directly adjacent to the raw material warehouse, which has a high fire load.
If fire spreads there, estimated downtime could reach 3–4 weeks at a facility generating Rp 2 billion per day in output, which translates to a direct loss of Rp 42–56 billion, before accounting for contract penalties.
The paint room stores hundreds of millions of rupiah worth of paint stock and sits adjacent to the main electrical panel, making its consequences very high despite its lower probability.
Step 5: Risk Scoring and Prioritization
Risk value is derived by multiplying probability by consequence. The results are used to build a risk matrix showing which areas or processes require immediate action, which can be scheduled, and which can be monitored periodically.
| Area | Priority | Primary Recommendation |
| Paint Room | PRIORITY 1 | Gas detector installation, suppression system upgrade |
| Welding Station | PRIORITY 2 | Strengthened hot work procedures, heat detector installation |
| Finished Goods Warehouse | MONITOR | Strict periodic inspection, fire compartmentation evaluation |
| Fabrication Area | MONITOR | Preventive maintenance schedule and routine audits |
In practice, accurate risk scoring requires a deep understanding of your facility’s specific production processes, which cannot be achieved without the right technical expertise.
For results that are valid and meet regulatory and insurance standards, engaging a professional fire protection consultant is strongly recommended.
The Lumeshield team, for example, with 10+ years of experience and certifications from BNSP and LPJK, as well as FM Global training in Kuala Lumpur, is ready to carry out this process with a technically rigorous and accountable calculation approach.
Application Across Industry Sectors: Case Studies & Cost Estimates
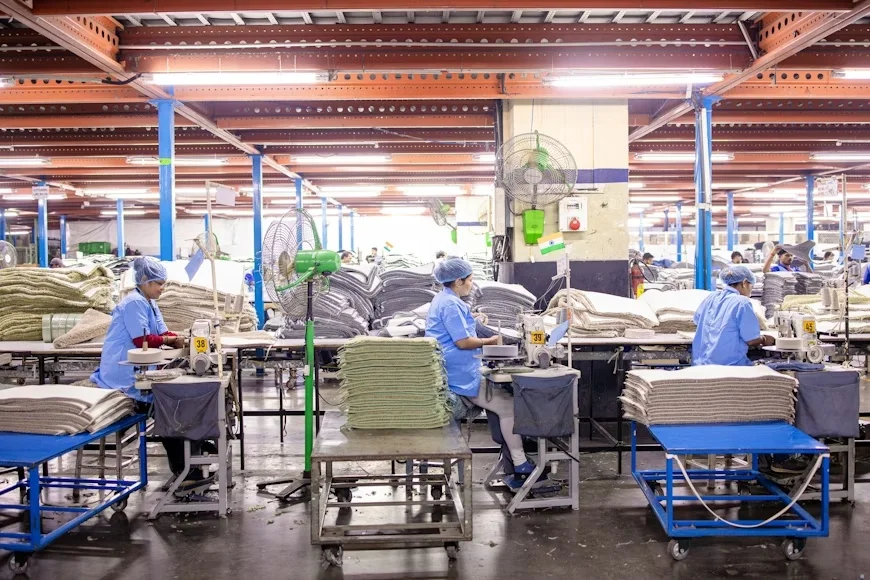
Case 1: Textile Factory — PT TAK Textiles Indonesia, Cikarang (November 2025)
A major fire struck PT TAK Textiles Indonesia in the Jababeka Industrial Estate, Cikarang Utara, in the early hours of November 25, 2025.
The fire is suspected to have started from an electrical short circuit in the production warehouse before rapidly consuming an area filled with fabric materials.
Losses were estimated in the billions of rupiah, approximately 440 workers across three shifts were sent home, and containment took 12 hours due to the building’s dense structure and the heat-retaining nature of textile materials.
This case illustrates why fire load mapping per production zone cannot be skipped.
Without it, installed detection and suppression systems are almost certainly not designed for the actual intensity of a fire when it occurs; as it grows and spreads, the systems cannot hold it back.
Case 2: Logistics Warehouse — Lazada, Sidoarjo (December 2023)
A fire hit Lazada’s e-commerce storage warehouse in Taman District, Sidoarjo, East Java, on December 8, 2023, resulting in losses reaching billions of rupiah.
What stands out about this case is that Lazada’s Chief Logistics Officer confirmed that Surabaya operations were unaffected. Parcel deliveries continued without delay, a rapid response only possible because a business continuity plan had already been prepared.
This contrast illustrates two very different scenarios: companies with and without fire risk assessment integrated into their business continuity plan.
Logistics warehouses store high-fire-load-density materials such as cardboard and plastic wrap while simultaneously serving as critical nodes in the distribution chain.
A fire that shuts down the main warehouse without a backup plan can mean hundreds to thousands of delayed deliveries, with SLA and reputational consequences that far exceed the physical losses.
Compliance, Regulatory, and Insurance Implications
Regulatory Audits
Permenaker No. 2/1983 on Automatic Fire Alarm Installations and Kepmenaker No. Kep. 186/Men/1999 on Workplace Fire Response Units requires adequate risk assessment and protection system documentation.
Audits from the Ministry of Manpower, BPBD, and the Fire Department are becoming more intensive.
Facilities without a structured fire risk assessment are vulnerable to administrative sanctions or temporary operational suspension.
Industrial Property Insurance Requirements
World-class insurers FM Global, Zurich, AXA XL, and Liberty Mutual now require a process-based fire risk assessment as part of the underwriting process for industrial property policies valued at Rp 50 billion or more.
Without standards-compliant assessment documentation, companies risk claims being denied on grounds of material non-disclosure, coverage limited to sub-limits far below asset value, or premiums subject to a 15–40% loading charge due to poor risk grading.
Risk Grading and Its Impact on Premiums
Facilities with comprehensive fire risk assessments and standards-compliant protection systems can achieve better risk grades.
For large facilities, a single-grade improvement can translate into an annual premium difference of Rp 200 million or more.
Lumeshield: Process-Based Fire Risk Assessment Integrated with Compliance and Insurance
Lumeshield helps manufacturing companies, logistics operators, commercial facilities, and process industries conduct process-based fire risk assessments that meet technical standards while delivering measurable business value.
Lumeshield’s approach covers comprehensive mapping of every production stage to identify actual risk points, evaluation of existing protection systems, data-driven fire scenario simulation, and the development of a structured mitigation plan with clear prioritization.
All work references NFPA, FM Global, and ISO 31000 standards, meaning results can be used directly to satisfy regulatory audit requirements, support insurance premium negotiations, and serve as a defensible basis for protection investment decisions presented to stakeholders.
Lumeshield offers initial consultation sessions to discuss your facility’s fire risk profile.
You will receive a clear picture of the most critical areas, an assessment approach matched to your facility’s scale, and a scope-of-work estimate before making any further commitment.
📞 Contact the Lumeshield Team to Schedule a Consultation Session